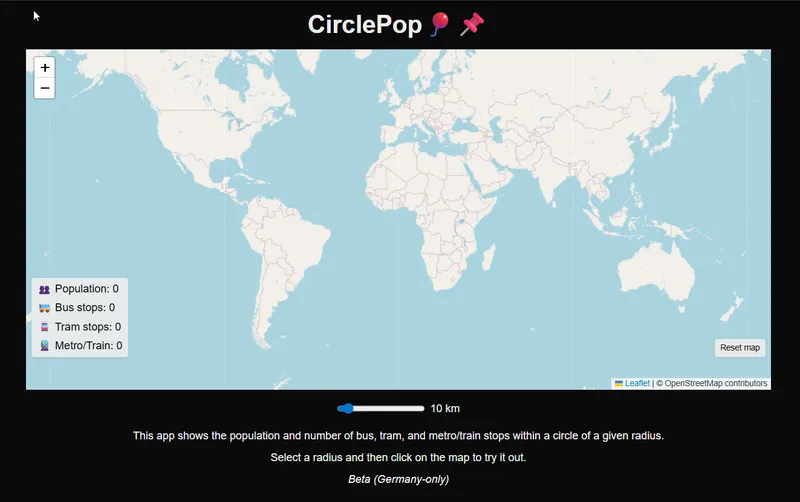
Circlepop is a quick side project exploring maps + open data to visualize urbanist data using Neon for Postgres hosting and Vercel for the Next.js frontend.
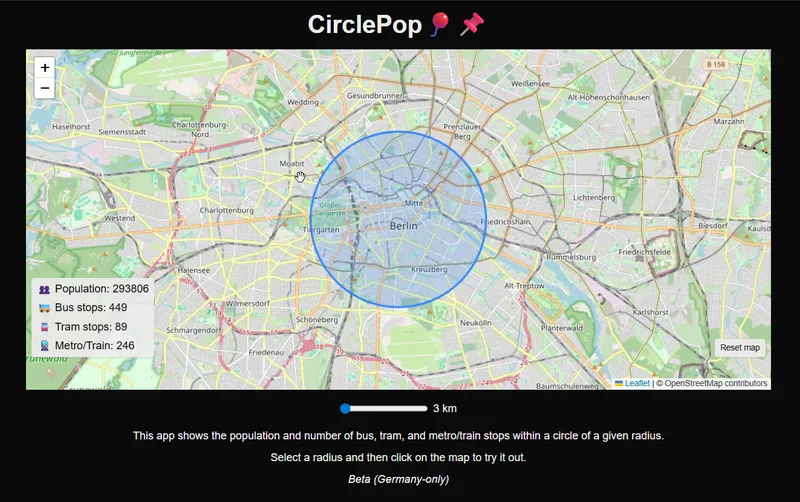
Select a radius and a point on the map (currently Germany-only for faster processing) to see the population within that circle as well as the number of train, tram, and bus stops.
The main challenges included downloading raster data from the Global Human Settlement Layer at 1 km resolution, loading the .tiff population raster into PostGIS, transforming it to centroid rasters for Germany, and storing it. I used a similar approach with OSM data for transit stops.
At a glance, the data is surprisingly accurate, though transit stop coverage likely has gaps in some regions. Improvements could include expanding coverage globally, increasing resolution in dense urban areas, adding caching strategies for performance, and visualizing transit stops on the map instead of only displaying counts.
Credit to Tom Forth for the inspiration—our approaches diverged (PostGIS here vs SQLite in his version).